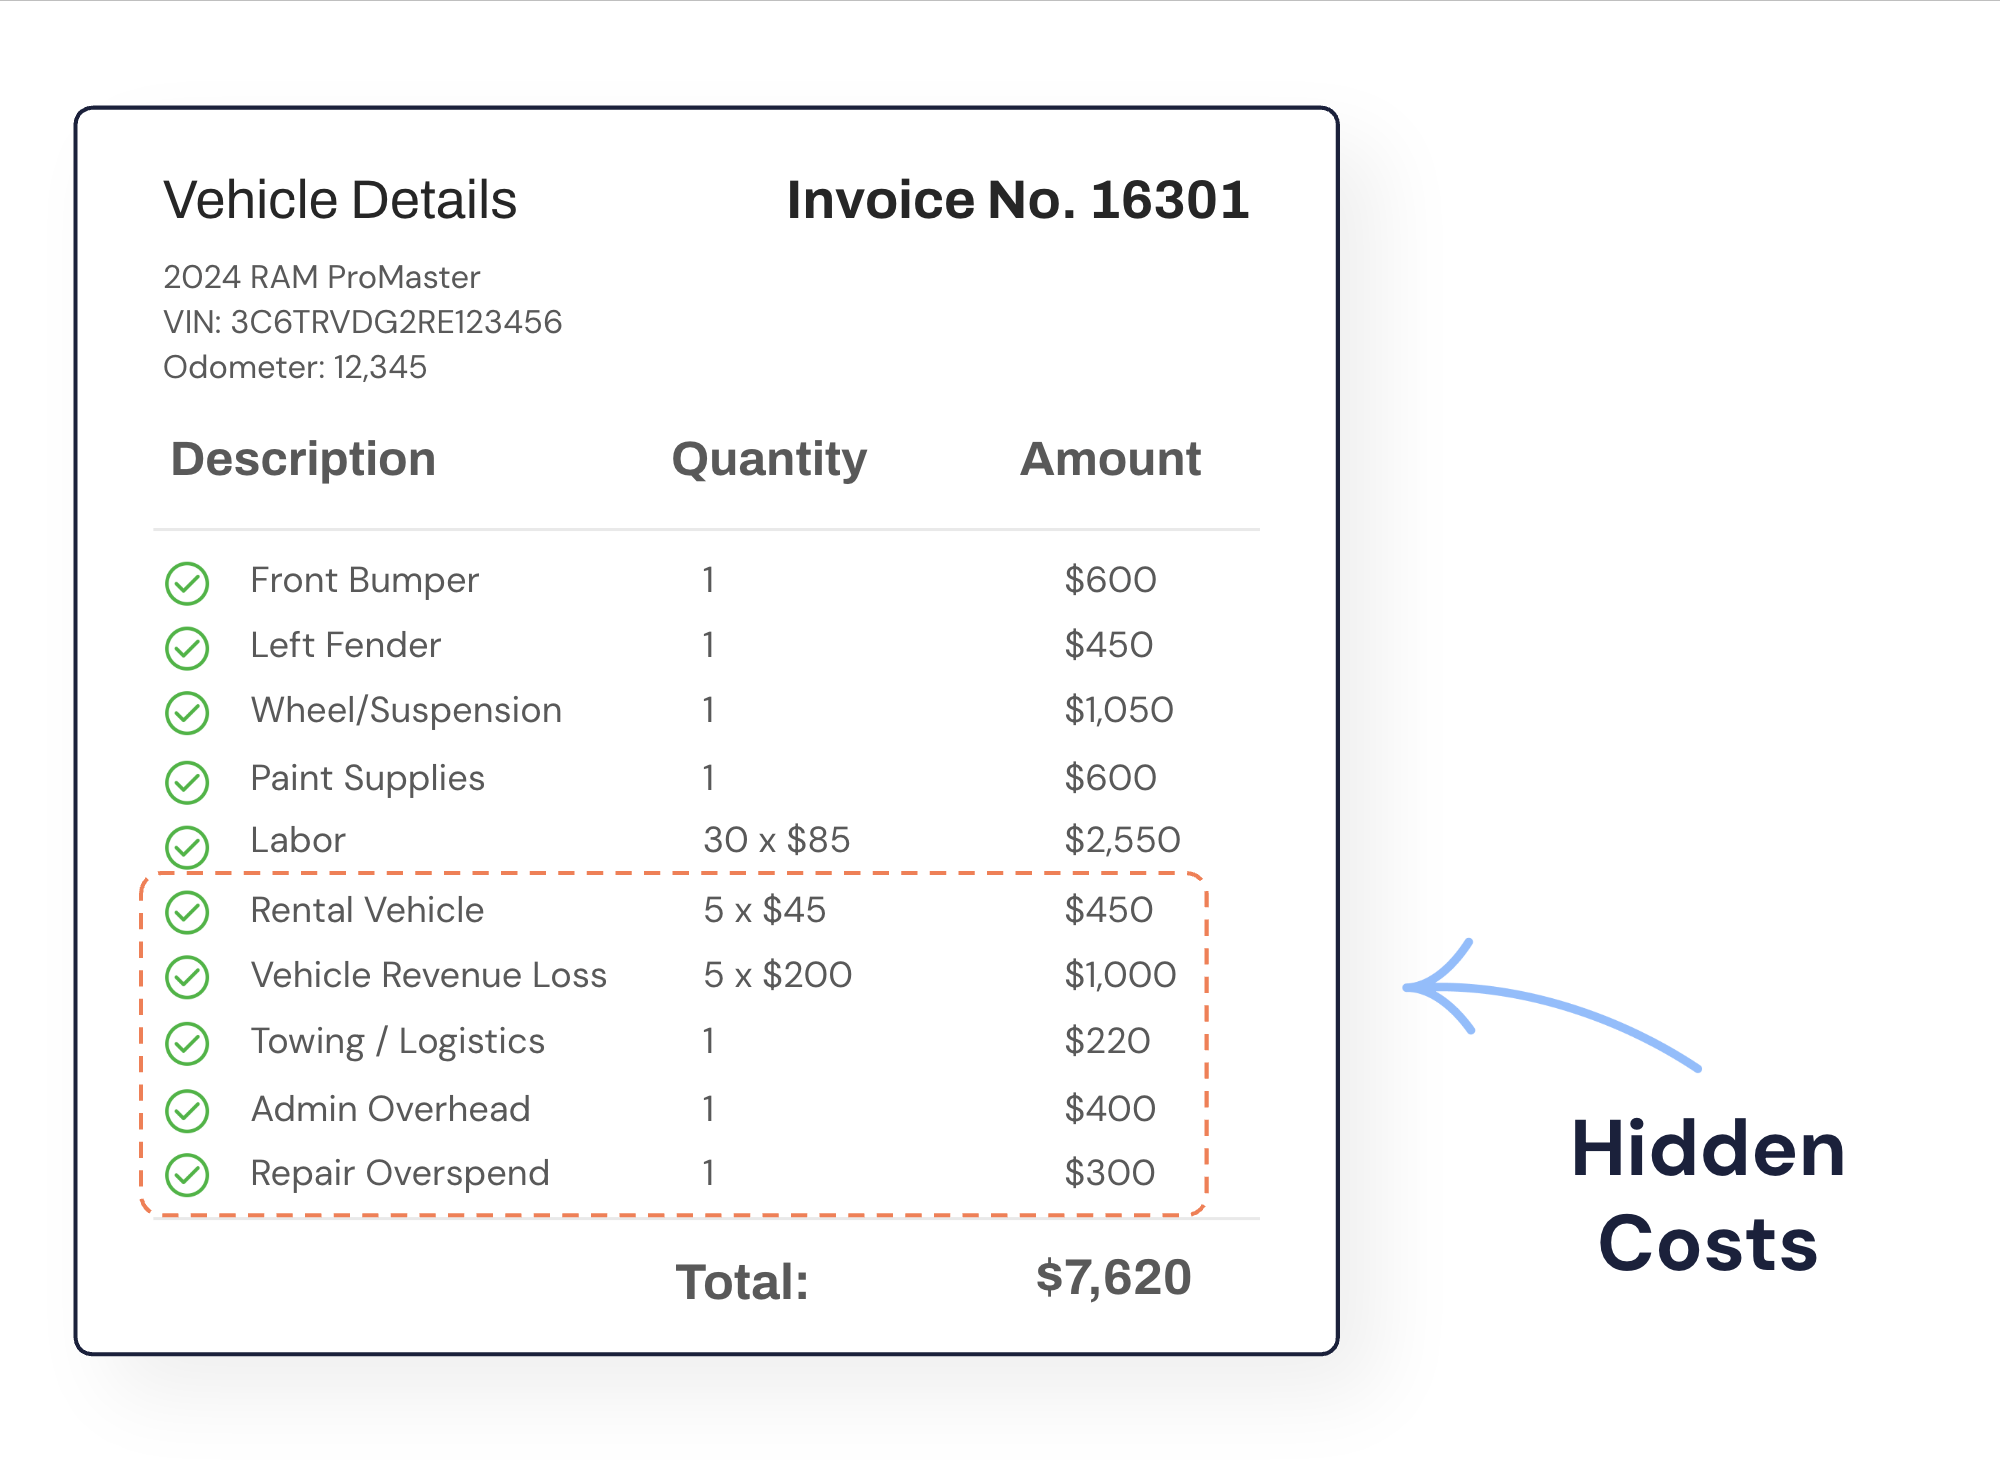
Parts, labor, tax, total. The invoice is the most precise document in the whole repair process and the least informative.
What it does not show is the 40 minutes your coordinator spent on hold, the two days the estimate sat unread, the three line items priced above your matrix that nobody had time to check, or the comeback in six weeks for the same complaint. Those costs are real, they are recurring, and they are measurable. Most fleets simply do not measure them.
This is the cost of the repair process itself, separate from the cost of the vehicle being off the road. Both matter. This one is the cheaper of the two to fix.
The four leaks
Coordination labor
Every RO (repair order) carries internal touch time: intake, finding a shop, chasing an estimate, relaying an approval, answering a driver, reconciling an invoice. None of it is billed to anyone. All of it is paid. Automotive Fleet notes that coordination problems between shops and fleet managers are a leading cause of repair delays, which means this leak funds the next one.
Approval latency
The estimate arrives. Someone has to read it, check it against policy and warranty, decide, and tell the shop. Every hour between arrival and answer is an hour the vehicle is parked and the bay is idle. This is the single most controllable number in the whole process and the one fleets track least, because it lives in an inbox rather than a system.
Markup and line-item leakage
A labor rate half a point above the agreed matrix. A shop supplies line that should be capped. A part billed at list when your agreement says list minus fifteen. A repair covered under warranty and billed anyway. Each one is small enough to wave through when you have 40 estimates in a week, and that is exactly why they persist.
Rework and invoice variance
A comeback is not one problem, it is a second full cycle: another intake, another approval, another set of days off the road, and often another invoice. Separately, the gap between the estimate you approved and the invoice you received is a number worth tracking on its own. A shop whose invoices routinely land above the approved estimate is not necessarily cheating you, but it is telling you its estimating is unreliable, and unreliable estimating breaks every downstream forecast you make.

Put a number on each one
Five definitions. Each is computable from data you already have, and each gives you something to negotiate with.
- Touch time per RO. Total internal minutes logged against repairs divided by repair orders closed. If nobody logs time, sample it for two weeks with a timer.
- Approval latency. Median hours from estimate received to estimate approved or rejected. Track the median and the 90th percentile, because the tail is where the damage is.
- Estimate-to-invoice variance. Final invoice minus approved estimate, divided by approved estimate. Report it per shop, as a median and as a 90th percentile.
- First-pass approval rate. Estimates approved without a revision request, divided by all estimates. A low rate means your policy is not reaching the shop before the estimate is written.
- Comeback rate. Repair orders reopened for the same complaint within 30 days, divided by repair orders closed. Anything you cannot attribute to a specific shop is a data problem, not a quality problem.
What it adds up to
Take a 120-unit fleet closing 45 repair orders a month on roughly $90,000 of invoiced repair spend.
Coordination: say 47 minutes of internal touch time per RO across intake, shop calls, estimate chasing, status updates, and invoice reconciliation. That is 35 hours a month. At a fully loaded $38 an hour, about $1,340 a month, or a fifth of a full-time position doing nothing but relaying information.
Approval latency: say one RO in five sits an extra day and a half waiting on a decision. That is nine ROs and about 13.5 extra vehicle-days a month. Priced at the low end of the published downtime range, $448 per vehicle per day (Fleet Management Weekly, Platform Science, EasiTrack), that is about $6,050 a month.
Leakage: say 6% of line-item value is priced above your agreed terms and none of it gets caught. On $90,000 of spend, $5,400 a month.
Add those three and you get roughly $12,800 a month sitting on top of $90,000 of invoiced work. About 14%, none of it printed anywhere, all of it recurring. Change the assumptions to match your own operation and the shape holds: the process costs a meaningful fraction of the repair.
This is also why inflation is the wrong thing to worry about first. Parts and labor prices move a few points a year. The TMC and FleetNet America quarterly report found the average roadside repair now exceeds $330 per event and continues to climb, which is worth knowing, but a single repair order that sits unapproved over a long weekend can cost more than a year of that drift.
Questions to take to your next shop or vendor review
- Show me median approval latency by shop for the last quarter, and the 90th percentile alongside it. If the system cannot produce it, ask who is holding the estimates.
- What share of invoices exceeded the approved estimate by more than 5%, and who authorized the difference?
- How many estimates came back for revision before approval, and what were the top three reasons?
- What is our comeback rate by shop, and does any shop appear in both the cheapest-quartile list and the highest-comeback list?
- Which pricing rules are actually enforced before an estimate is approved, rather than argued about after the invoice arrives?
- How many internal hours a month does this account consume on our side, and what would it take to cut that in half?
Common questions
Is this the same thing as total cost of ownership?
No. TCO (total cost of ownership) spans acquisition, fuel, insurance, maintenance, and disposal across a vehicle’s life. What is described here is narrower and more immediate: the overhead generated by the repair process itself, which sits inside the maintenance line of TCO and is usually invisible there. You can attack it this quarter without touching your replacement cycle.
How do I track approval latency if estimates arrive by email?
Start by timestamping two events for every estimate: received and answered. A shared mailbox with a simple log will do for a month, which is long enough to get a median and to find out which shops and which approvers sit at the tail. Once you can see the tail, the fix is usually a threshold that lets small, policy-compliant repairs approve without a human in the loop.
Does auditing every estimate slow the repair down?
It does if a person does it. The reason fleets skip the audit is that a careful review takes 20 minutes and they have 40 estimates waiting. Rules-based checking against your pricing, warranty, and maintenance policy runs in seconds and escalates only the exceptions, which reverses the tradeoff instead of splitting the difference.
Which of the four leaks should I fix first?
Approval latency, almost always. It is the cheapest to measure, it needs no negotiation with a shop, and it compounds directly into downtime cost. Leakage is worth more per dollar recovered but requires enforced pricing rules to fix properly, so it is a second move rather than a first one.
ServiceUp is the agentic repair platform for modern fleets. Every estimate is audited against your pricing, warranty, and maintenance policies, overcharges get flagged, valid repairs approve in seconds, and the coordination between intake and payment is handled by agents rather than by your team. Across fleets running on the platform, that shows up as 21% lower repair costs. More at serviceup.com/fleets.