
.png)
A van sitting in a shop lot is still on your books. Still insured, still financed, still assigned to a route, and earning nothing.
Most fleets can tell you what a repair cost. Far fewer can tell you what the four days cost. The second number is usually bigger, and it is the one that decides whether your cost per mile moves this quarter.
So build it. Not as a general feeling that downtime is bad, but as a per-vehicle, per-day figure you can defend in a budget review.
Start with one number: cost per vehicle-day
Downtime cost is four things added together, counted for every calendar day a unit is out of service, including weekends when the shop is closed and the vehicle still is not working.
- Lost contribution margin. Daily revenue the unit would have produced times your contribution margin, not your gross margin and not your revenue.
- Substitute capacity. The rental day rate, the carrying cost of a spare that exists only for this, or the overtime you pay to cover the route with the trucks you still have.
- Unrecovered labor. Wages paid for hours that produce nothing, including the hours a driver or a coordinator spends waiting on a decision instead of working.
- Penalty exposure. Contractual SLA (service level agreement) penalties, missed-window fees, and the credits you issue to keep an account calm.
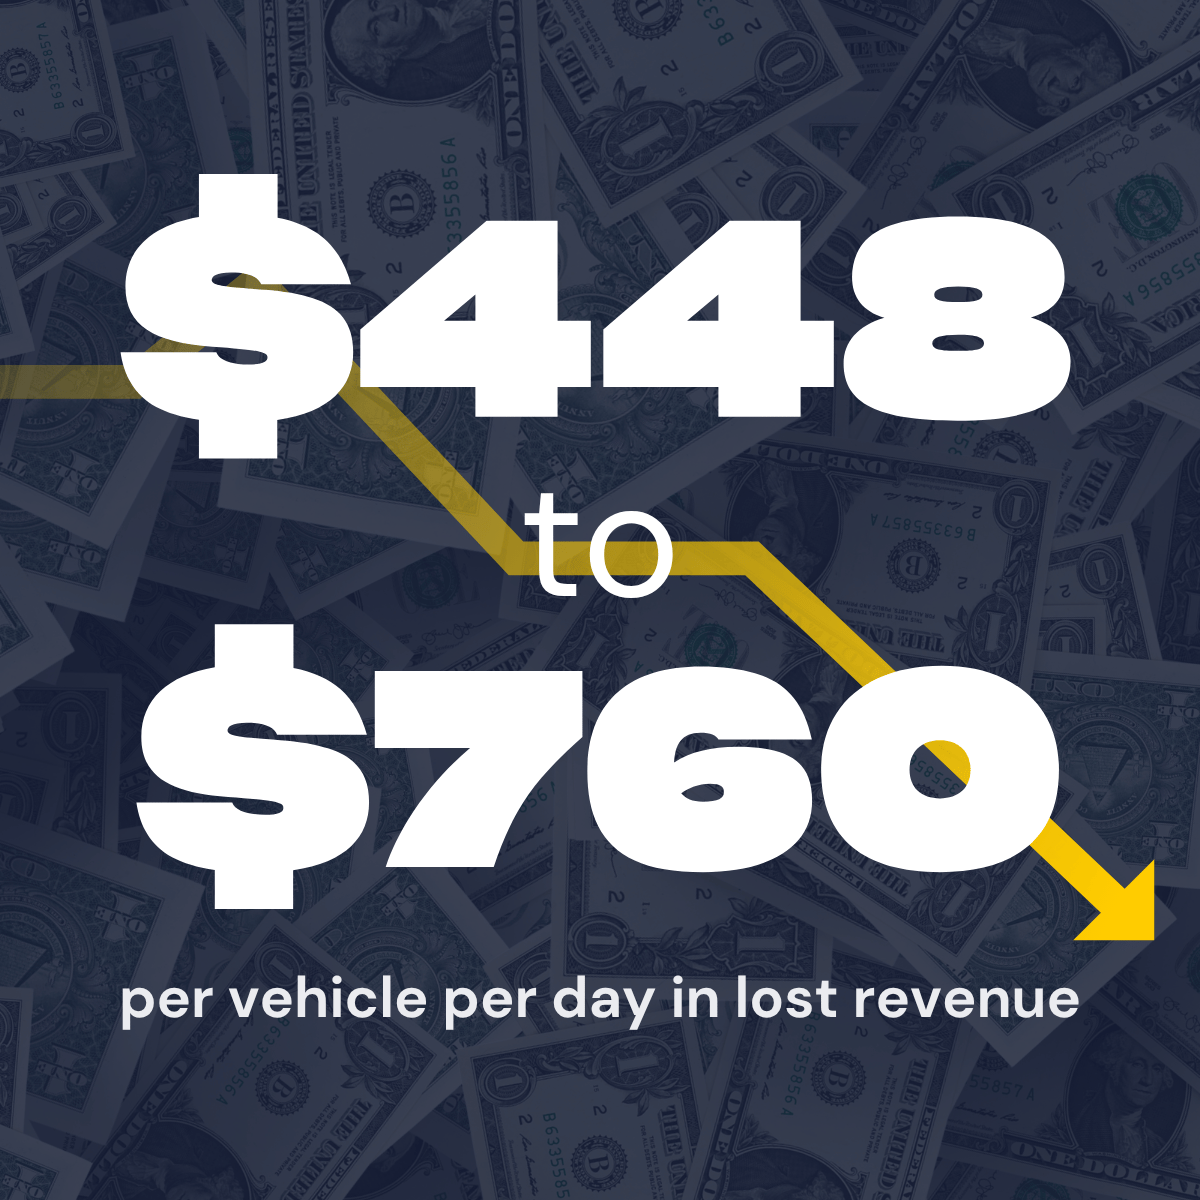
Published estimates put the average somewhere between $448 and $760 per vehicle per day in lost revenue (Fleet Management Weekly, Platform Science, EasiTrack). Treat that as a sanity check on your own arithmetic, not as your number. A cargo van on a fixed DSP (delivery service provider) route and a Class 6 box truck on spot work do not belong on the same line.
Two rules make the number honest. Count calendar days, not shop days, because the customer does not care that Saturday was not billable. And count from the moment the vehicle stopped earning, not from the moment the RO (repair order) was opened. The gap between those two timestamps is usually the most expensive part of the whole event.
Where the days actually go
Very little downtime is repair time. Pull your three longest jobs from last quarter and write down what the vehicle was waiting on each day. The pattern is almost always the same handful of failures.
The van that sits two days in your own yard because nobody has booked it into a shop yet. The unit that has been ready since Tuesday afternoon and gets collected Friday because no driver was free. The tow that went to the nearest shop rather than the right one, followed by a second tow when that shop could not take the work. The spare that was already committed to another branch. The estimate that landed at 4:40 on a Friday and sat until Monday because the person who could approve it was on a plane.
Skipped maintenance is its own category, and it is expensive in a way that compounds. Emergency repairs run roughly three to nine times the cost of preventive ones, and they arrive on someone else’s schedule, usually on the shoulder of a highway, usually with a tow attached. A PM (preventive maintenance) interval you skip in a busy month buys you a roadside event in a busier one.
Then there is the cost that never shows up in a report. Late deliveries rarely produce an angry phone call. They produce a quiet reallocation of volume at the next contract review. In a business where most customers lean heavily on referrals and reputation, the account you lose to repeated missed windows does not tell you why it left.
Run it on your own fleet
Here is the arithmetic on a 40-van last-mile fleet. Six repair events a month, averaging 4.2 calendar days off the road each. That is 25.2 vehicle-days a month. At the low end of the published range, $448, that is about $11,290 a month, or roughly $135,000 a year in downtime cost alone, before a single invoice is paid.
Now cut average duration to 2.8 days. Same six events, same repairs, same shops. You are at 16.8 vehicle-days, about $7,526 a month. The difference is roughly $45,000 a year. If your operation sits at the top of the range rather than the bottom, that same 1.4-day improvement is worth about $76,600.
Notice what that example does not require. No fewer breakdowns, no cheaper parts, no new vehicles. Just fewer days between the moment a van stops earning and the moment it starts again. That is why cycle time, measured in calendar days from out-of-service to back-in-service, is the metric worth putting on the wall.
What to do Monday morning
- Pull the last 90 days of ROs and add two timestamps to each one: the date the vehicle went out of service and the date it returned to service. Not the invoice date. If you cannot produce those two dates, that is the first thing to fix.
- Build one cost-per-vehicle-day figure for your single largest route type, using your own revenue and your own contribution margin. One number, defensible, this week. Add vehicle classes later.
- Price your substitute options properly. Get the rental day rate in writing and calculate the annual carrying cost of a spare unit, then compare both against the cost-per-day number you just built.
- Take your three longest jobs from last quarter and reconstruct them day by day. Write down what the vehicle was waiting on. Most fleets find that more than half the elapsed days had nothing to do with wrenching.
- Set a cycle-time target and review it weekly with the same seriousness you review spend. A cost target with no time target will quietly push vehicles toward the cheapest shop with the longest queue.
Questions fleet managers actually ask
What is a realistic downtime cost per vehicle per day?
The published range of $448 to $760 is a reasonable starting bracket for commercial units, but your own figure is the one that matters. A van on a contracted route with penalty clauses can sit well above that range. A pool sedan used for occasional site visits sits far below it. Build the number from your own revenue and margin rather than adopting an average.
Should I count driver wages if I redeploy the driver?
Count only the hours you cannot recover. If the driver covers another route that would otherwise have gone to overtime, you saved money and should not book a loss. If the driver spends four hours on a phone chasing status and then goes home, that is real cost. Redeployment is the reason the honest number is usually lower than the scary number, and also the reason it holds up in a finance review.
How do I avoid double counting downtime against repair cost?
Keep them in separate columns and never net them. Repair cost is what you paid the shop. Downtime cost is what the absence cost the business. They are added, not blended, and they respond to different levers. A cheaper shop that takes three extra days usually loses money on the combined line.
Is a spare pool cheaper than paying for faster repairs?
Compare the annual carrying cost of a spare against your cost-per-vehicle-day multiplied by the vehicle-days it would actually absorb. Spares cover volume, not duration, so they work well for fleets with steady, predictable repair volume and poorly for fleets whose problem is a handful of jobs that run two weeks. Most fleets discover the duration problem is cheaper to fix.
ServiceUp is the agentic repair platform for modern fleets. Agents handle intake, shop routing, estimate review, approval, and the follow-up that consumes most of the elapsed days in the examples above, so the vehicle spends its time being repaired rather than waiting to be. Across fleets running on the platform, that shows up as 32% faster cycle times. More at serviceup.com/fleets.

.png)

.png)


